Data and reporting
Business KPI dashboard
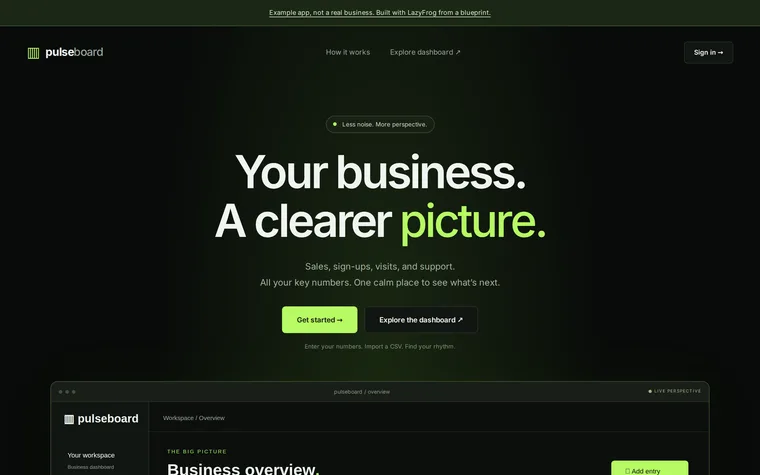
What you get
- Metrics fed from your tools on a schedule
- Manual entry and CSV import
- Charts by week and month
- A Monday summary email
- A read-only link to share
The prompt
Change the names, prices and details to yours. Your AI needs LazyFrog connected first: two minutes.
Use LazyFrog to build a dashboard of my business's key numbers (sales, sign-ups, website visits, support tickets): enter them or import a CSV, see charts by week and month, and share a read-only link. For the look: dark mode, near-black with electric-green accents, compact number cards with small trend lines, a slim left sidebar, and a public landing page with a picture of the dashboard before the sign-in.
The live demo
What Codex built from that prompt on 14 November 2026, in about 6 minutes, then published as an example. Try it: what you add is put back every night.
| Business owner | owner@pulseboard.demo | demo1234 |
|---|
The full spec
The same app with every detail named: the pages, fields and tables. Use it when you want exactly this app; the short prompt leaves those choices to your AI.
Use LazyFrog to build a dashboard of my business's key numbers (sales, sign-ups, website visits, support tickets). Metrics go in a table called metrics (name, unit, aggregation as sum or last) and their values in metric_values (metric_id, date, value, source: manual, csv or a source's name), one dated row per value. The app is for me and lives under /admin, protected with LazyFrog's protected pages (I'll choose the password in the portal): /admin shows a chart per metric by week (weeks start on Monday) or by month, with this period against the last. I add values by hand, or upload a CSV file with the header metric,date,value (a multipart POST to /admin/import, the file in the field file), and a metric that doesn't exist yet is made, adding up its values. My other tools feed it through sources (a table called sources: name, metric_id, url, json_field, key_secret_name): each is a URL that answers JSON, whose json_field holds the number stored as that day's row; when the URL needs an API key, the source names the LazyFrog secret that holds it (such as ANALYTICS_API_KEY, sent as a Bearer token) and I add the key myself in the portal, never in the code, the database or this chat. Saving a source doesn't fetch it. One cron job, every hour, fetches each source once a day, and on Mondays at 8:00 also emails me (the owner) last week's summary: each metric's total or last value against the week before. I can make a read-only link to share at /share/<token> (a random token of at least 128 bits) with the same charts, rendered on the server on every request (each metric's name and its latest figures in the HTML itself, the charts drawn on top of that, never filled in only by the browser, so the link shows its numbers straight away), and turn it off again. Add a JSON API for me: POST /admin/api/values with {"metric", "date", "value"}; GET /admin/api/series?metric=<name>&by=week or by=month answers {"metric", "by", "points": [{"period", "value"}]} with every period that has values, oldest first, the period being the week's Monday as YYYY-MM-DD or the month as YYYY-MM and the values JSON numbers; POST /admin/api/sources with {"name", "metric", "url", "json_field", "key_secret_name"} answers {"id"}; POST /admin/api/shares (no body) answers {"token"}. Start with four metrics and twelve weeks of example values.
The full spec was built and checked on LazyFrog on 31 October 2026. It took about 4 minutes.